The Sun's Output Is Lying to Your Climate Model: Why Tiny Fluctuations Have Enormous Consequences
There's a number that shows up in almost every introductory physics textbook: 1,361 watts per square meter. That's the so-called solar constant — the amount of energy the Sun delivers to the top of Earth's atmosphere. Tidy. Reliable. Reassuringly stable.
Except it isn't constant. Not even close.
The Sun's energy output wobbles. It dips and rises across the 11-year solar cycle by roughly 0.1%, sometimes a hair more. And for a long time, scientists looked at that number and collectively shrugged. A tenth of a percent? Against the backdrop of greenhouse gas forcing, volcanic eruptions, and ocean circulation shifts, that sounds like rounding error. Climate modelers filed it away as negligible and moved on.
That decision is coming back to haunt them.
How We Got Comfortable With the Wrong Assumption
Before satellites, measuring the Sun's actual energy output was genuinely hard. Ground-based instruments had to fight through atmosphere, weather, and instrument drift. The readings were noisy enough that small real variations got swamped by measurement error. So the working assumption — that the Sun was basically steady — wasn't crazy. It was practical.
The problem is that practical assumptions have a way of calcifying into received wisdom. By the time the scientific community had satellites capable of doing better, the 'solar constant' framing was already baked into climate models and the language scientists used to talk about the Sun's role in Earth's energy budget.
When NASA's Solar Maximum Mission launched in 1980 and started delivering clean, above-atmosphere irradiance data, the results were uncomfortable. The Sun wasn't constant. It dimmed during solar minimum and brightened as sunspot activity climbed. The variation was small — but it was real, and it was systematic.
More importantly, it wasn't behaving the way anyone had predicted.
The Satellite Revolution That Changed Everything
Decades of continuous satellite monitoring — through missions like ACRIM, SORCE, and more recently TSIS-1 aboard the International Space Station — have built a detailed picture of what scientists now call Total Solar Irradiance, or TSI. And that picture is genuinely strange.
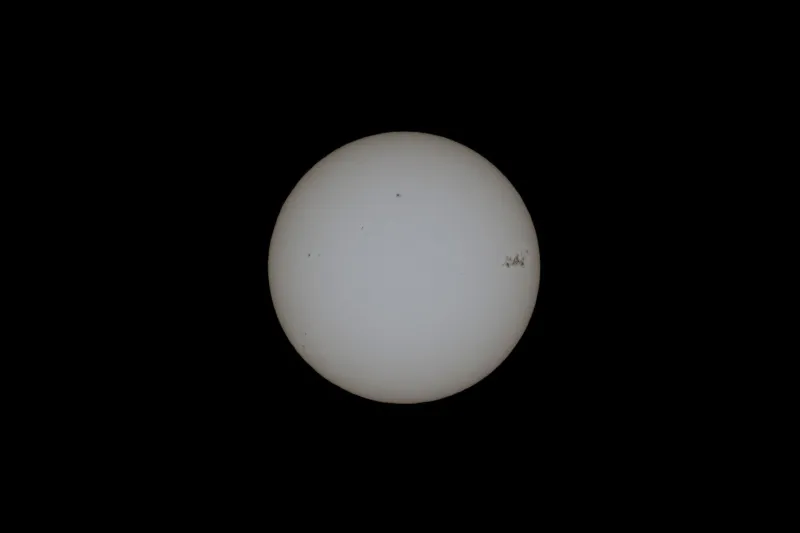
For one thing, the Sun actually gets slightly brighter when sunspots are most numerous, not dimmer. Sunspots are cooler, darker regions, so intuition says more sunspots should mean less light. But sunspots travel with bright magnetic structures called faculae, and faculae win the brightness competition. The net effect is a small but measurable increase in total output near solar maximum.
For another, the variation isn't uniform across wavelengths. Ultraviolet output swings by several percent across the solar cycle — a much larger relative change than the total irradiance number suggests. And UV radiation does specific things to the stratosphere: it drives ozone chemistry, heats the upper atmosphere, and sets off a cascade of dynamical effects that can propagate downward and influence surface weather patterns.
That top-down pathway — solar UV hitting the stratosphere and eventually nudging the jet stream, storm tracks, and regional precipitation — is where things get genuinely complicated for climate modelers.
Why 0.1% Punches Above Its Weight
Earth's climate system isn't a simple input-output machine. It's a network of feedbacks, amplifiers, and nonlinear responses stacked on top of each other. A small nudge in the right place doesn't stay small.
Researchers studying the Maunder Minimum — a period from roughly 1645 to 1715 when sunspots nearly vanished — found that Europe experienced a stretch of brutal winters and cooler summers that historians call the Little Ice Age. The TSI reduction during the Maunder Minimum was probably only around 0.1% to 0.3% below modern values. That's not much. But it coincided with enough regional climate disruption that crops failed and rivers froze that normally don't.
The mechanism isn't fully pinned down. Some researchers point to the stratospheric UV pathway. Others argue for solar wind effects on cloud formation through cosmic ray modulation — a theory that remains contested but hasn't been fully ruled out. Most likely, several pathways operate simultaneously and interact in ways that current models still struggle to capture.
What the Maunder Minimum case makes clear is that even modest TSI changes, sustained over decades, can leave fingerprints on climate that are visible without a microscope.
The Modeling Problem Nobody Likes to Talk About
Here's the uncomfortable part for climate science: if small solar variations matter more than the 0.1% headline number implies, then models that treat TSI as essentially flat are missing something. Not necessarily something that overrides anthropogenic warming — the evidence for human-caused climate change is overwhelming and doesn't hinge on this question — but something that could affect regional predictions, the timing of climate shifts, and the accuracy of projections under different solar activity scenarios.
Several modeling groups have started incorporating more sophisticated solar forcing, including spectrally resolved irradiance changes and stratospheric chemistry responses. The results suggest that solar variability can influence precipitation patterns over the US Southwest, shift the position of the Hadley circulation, and affect Atlantic hurricane tracks — all through mechanisms that a flat TSI assumption would miss entirely.
The problem is that the satellite record of TSI only goes back to 1978. That's barely two solar cycles of clean data. Reconstructing solar output further back requires proxies — sunspot records, cosmogenic isotopes in ice cores and tree rings, geomagnetic records — and those proxies carry their own uncertainties. Pinning down exactly how much the Sun varied during, say, the Medieval Warm Period is still an active and occasionally heated scientific debate.
What Comes Next
Solar Cycle 25, which kicked off around 2019, has been tracking stronger than many forecasters expected. If it continues to run hot, the next few years will give climate scientists a relatively bright Sun to work with — a natural experiment of sorts. Comparing actual climate observations against model predictions made under different solar forcing assumptions could help narrow down which mechanisms are real and how large their effects are.
Meanwhile, instruments like TSIS-1 are measuring TSI with better precision than any previous mission, and follow-on missions are in planning. The goal is to reduce measurement uncertainty to the point where even subtle long-term trends in solar output become detectable — because if the Sun is slowly brightening or dimming on centennial timescales, we'd very much like to know.
The solar constant, it turns out, was never really a constant. It was a placeholder — a convenient fiction that helped get the math done before we had the tools to do it right. Now we have better tools, and the math is getting more interesting.
Not easier. Not cleaner. But closer to true.