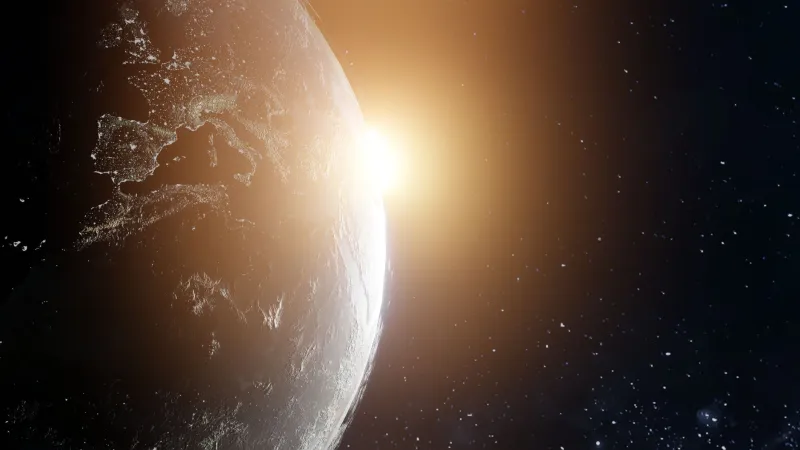
We've Been Watching the Wrong Thing on the Sun for 400 Years
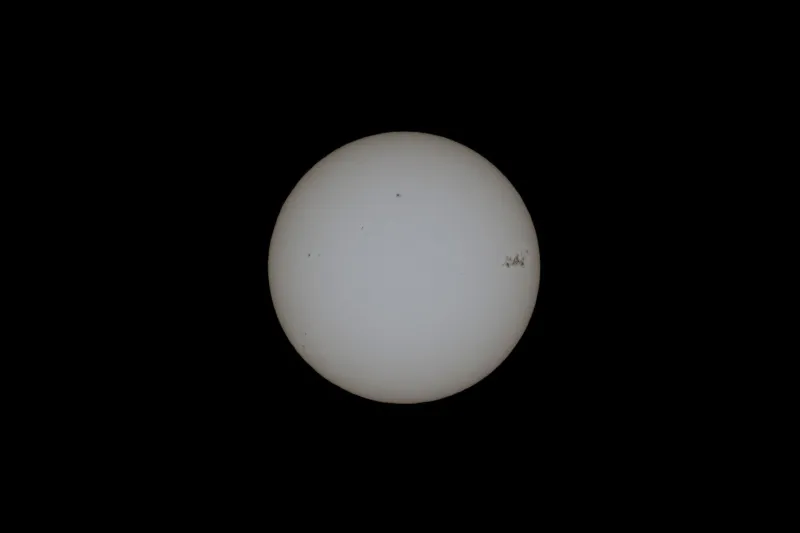
Galileo saw them. So did Chinese astronomers, centuries before him, who recorded dark blemishes crossing the solar disk and wondered what they meant. Sunspots have been humanity's primary lens on solar activity for as long as humans have been paying serious attention to the Sun — which, given that the Sun is the closest star and the engine of all life on Earth, is saying something.
And yet, according to a growing number of solar physicists, we may have spent four centuries staring at the wrong thing.
Not that sunspots are unimportant. They're real features, they're measurable, and they correlate with solar activity in ways that have proven genuinely useful. But they're also a little like watching a city from the air by counting parking lots. The parking lots tell you something. They don't tell you how the city actually works.
What actually runs the show on the Sun is something you can't see with your eyes — the magnetic field topology that connects sunspots, spans the solar surface, arches into the corona, and ultimately determines whether a given day on the Sun ends quietly or with a continent-sized explosion of plasma.
The Seduction of the Visible
The dominance of sunspot science is completely understandable from a historical perspective. For most of the history of solar astronomy, sunspots were what you had. They're visible in white light through a basic telescope. They're countable. They follow a cycle. You can build a 400-year dataset out of records from observatories, amateur astronomers, and even careful naked-eye observations during sunrise and sunset.
That dataset — the International Sunspot Number, maintained and regularly revised by the Royal Observatory of Belgium — is genuinely irreplaceable. There's nothing else that gives us a continuous proxy for solar activity stretching back to the early 1600s. When researchers want to understand how solar behavior has changed over centuries, or compare the current solar cycle to historical ones, they lean heavily on sunspot records.
The problem isn't that sunspot data is bad. The problem is that sunspot counts describe a symptom rather than the disease. They tell you that magnetic activity is happening. They don't tell you much about the structure of that magnetic activity — and structure, it turns out, is everything.
Magnetic Topology: The Invisible Scaffolding
Sunspots form where intense magnetic field lines burst through the solar surface. They travel in pairs — one with a north magnetic polarity, one with south — connected by invisible field lines arching above the surface into the corona. Around and between these pairs, more complex webs of magnetic field crisscross the photosphere, building structures that solar physicists categorize using systems like the Mount Wilson classification.
A simple sunspot pair with a clean, well-separated bipolar structure sits in a different risk category than a complex active region where multiple polarities are tangled together, where field lines of opposite orientation are pressed against each other, and where the magnetic geometry is primed for a process called magnetic reconnection — the sudden reconfiguration of field lines that releases enormous amounts of energy.
Two active regions with identical sunspot counts can have radically different magnetic topologies. One might be stable and quiet for its entire lifetime. The other might produce a dozen flares and multiple coronal mass ejections. Counting sunspots doesn't tell you which is which.
This is why solar flare prediction has historically been so frustrating. Models built primarily on sunspot area and count do better than chance, but not by as much as you'd hope for systems that are supposed to protect satellites, power grids, and astronauts. The missing ingredient isn't more sunspot data. It's better magnetic topology data.
The Shift to Magnetic Analysis
The tools to do this properly have only existed for a few decades. Magnetograms — instruments that measure the strength and polarity of the Sun's magnetic field across the solar disk — became standard equipment at major solar observatories starting in the mid-20th century. But the spatial resolution and temporal cadence of early magnetograms were limited.
The real revolution came with NASA's Solar Dynamics Observatory, launched in 2010. SDO's Helioseismic and Magnetic Imager produces high-resolution magnetic field maps of the entire solar disk every 45 seconds. For the first time, solar physicists could watch magnetic topology evolve in near-real-time, track the emergence and cancellation of flux, and quantify properties like magnetic helicity, free magnetic energy, and the gradient of the magnetic field across polarity inversion lines.
Those last two terms matter a lot. Free magnetic energy is the energy stored in a magnetic field configuration above the minimum energy state — it's the fuel for flares and CMEs. The gradient across a polarity inversion line — the boundary between regions of opposite magnetic polarity — is one of the best predictors of whether an active region will erupt. Neither of these quantities has any direct relationship to sunspot count.
When researchers go back and apply modern magnetic topology analysis to historical events — the Carrington Event of 1859, the Halloween Storms of 2003, the June 2012 CME that narrowly missed Earth — the magnetic geometry of the responsible active regions consistently shows characteristics that sunspot data alone would have underrepresented or missed entirely.
Reinterpreting Four Centuries of Records
This creates a genuinely tricky historical problem. The sunspot record is the backbone of long-term solar variability research. But if sunspot counts are a noisy, incomplete proxy for the magnetic topology that actually drives solar behavior, then conclusions drawn from that record need to be revisited.
How dangerous was the solar environment during the Maunder Minimum, when sunspots nearly disappeared? The traditional interpretation is that it was very quiet — few sunspots means low magnetic activity means few space weather events. But some researchers now argue that the relationship between sunspot count and magnetic topology complexity may not hold in low-activity regimes. A Sun with almost no sunspots might still produce occasional complex active regions capable of significant eruptions. We just wouldn't know from the sunspot record.
Similarly, periods of high sunspot count have traditionally been assumed to be uniformly dangerous from a space weather perspective. But a solar maximum dominated by simple, stable bipolar active regions might actually produce fewer severe events than a moderate solar cycle with a handful of highly complex, topologically unstable active regions.
The sunspot number is an average that hides enormous variance in what actually matters.
What We Should Be Watching Instead
The solar physics community hasn't abandoned sunspots — they're still useful, and the historical record is irreplaceable. But the cutting edge of both research and operational space weather forecasting is increasingly focused on magnetic topology metrics.
Concepts like the magnetic flux rope — a twisted bundle of field lines that can store and then suddenly release enormous energy — are now central to CME prediction models. Automated systems that classify active regions by their magnetic complexity, track the rate of flux emergence, and monitor changes in polarity inversion line structure are being integrated into operational forecasting workflows at NOAA and other agencies.
Machine learning is accelerating this shift. Neural networks trained on SDO magnetic field data can identify topological features associated with eruptions faster and more consistently than human classifiers — and they're finding patterns that don't map neatly onto traditional sunspot-based classification schemes.
The Sun has been trying to tell us something for four centuries. We were looking at the visible symptoms and calling them the cause. The real story was always in the invisible architecture underneath — in the magnetic webs we couldn't see and, for most of human history, didn't even know to look for.